How To Automate Daily Sales Reporting? Expert Guide
Over 70% of small businesses still track sales using spreadsheets or handwritten notes. That slows you down, introduces errors, and hides what’s really going on. If you’ve ever missed a trend or misread a sales dip, the issue might be your reporting process. All you need is to know how to automate daily sales reporting and set it up right.
Start by deciding what to track, choose a tool that fits your workflow, and set daily entries as a habit. From there, auto-generated reports and real-time summaries give you the clarity you’ve been missing.
One of the easiest ways to do this is through a mobile app designed for fast, accurate sales tracking. That’s where the Daily Sales Record comes in. It’s built for teams that need clean reports without the manual work.
Ready to fix your reporting? Let’s get into it.
How To Automate Daily Sales Reporting: A Step-by-Step Guide
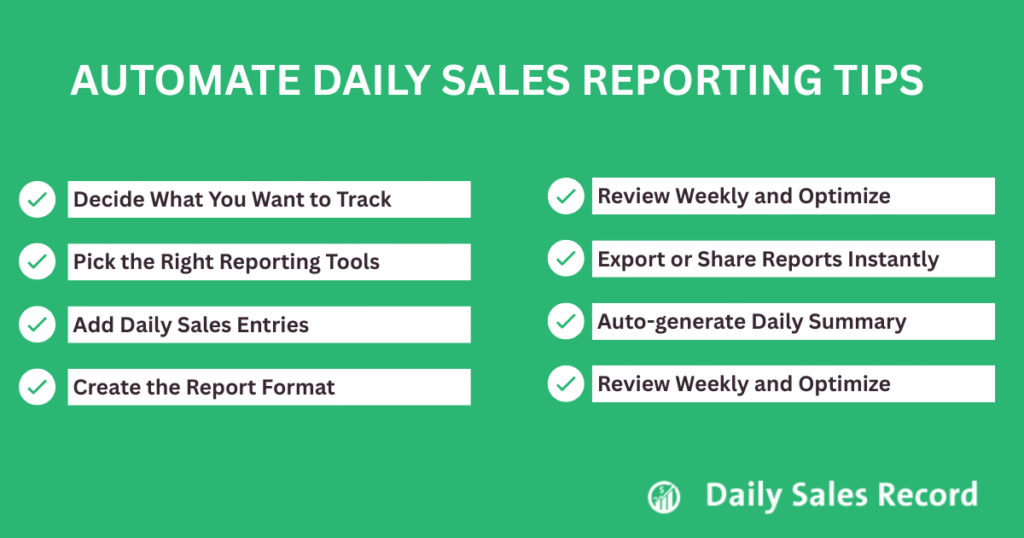
Step 1: Decide What You Want to Track
Before you automate sales reporting, you need to define what you’re tracking. This step gives direction to everything that follows.
Start by asking: What questions should your sales report answer?
- Do you want to see how much you sold today?
- Or how did each rep perform this week?
- You may be trying to find which product sells best every month.
Once you’re clear on your reporting goal, decide how often you’ll review it:
- Daily reports help track leads, calls, meetings, and new deals.
- Weekly reports focus on revenue, conversions, and top reps.
- Monthly reports reveal trends, drop-offs, and long-term progress.
Now pick the metrics that match your goals:
- Total sales and revenue
- Sales by rep or region
- Lead sources and conversion rates
- Product-wise performance
- New vs. returning customers
- Average deal size
- Funnel stage drop-offs
Step 2: Pick the Right Reporting Tools
Now that you’ve decided what to track, the next step is choosing a tool that fits your workflow. The right tool makes reporting faster, cleaner, and less stressful.
Below are four of the most practical tools used by small businesses and sales teams.
i) Spreadsheets (Google Sheets or Excel)
If you’re already using spreadsheets, you have a flexible foundation. You can build tables, add formulas, and create custom charts to track performance. Google Sheets includes a smart feature called Explore, which gives you instant visuals and insights based on your data. You can also automate some tasks using Google Apps Script.
ii) CRM Software (Salesforce, HubSpot, Zoho)
CRM tools are designed for teams that need to track deals, calls, contacts, and customer activity in one place. These systems offer built-in dashboards and reporting tools, showing you how your team performs across different stages of the sales process. CRMs are ideal if you have multiple reps, long pipelines, or a complex sales process.
iii) Automation Add-ons (Coefficient, Supermetrics)
If you want to stick with spreadsheets but make them smarter, automation add-ons are a great choice. Tools like Coefficient pull data from platforms like Salesforce, HubSpot, or your internal database directly into Google Sheets. You can set these to auto-refresh, so your reports stay up-to-date. You can also trigger email or Slack alerts when data changes.
iv) Mobile Sales Apps (Like Daily Sales Record)
If you want the simplest way to track sales daily, a mobile app like Daily Sales Record is the way to go. The Daily Sales Record app lets you input sales, assign them to reps, manage products and customers, and generate reports all from your phone. It’s fast, works offline, and syncs once you reconnect. Reports are automatically grouped by day, week, or month.
Step 3: Add Daily Sales Entries
Once your tool is ready, start logging your sales daily. This is the core of your entire reporting process. Enter each sale with key details like the product, amount, customer name, and date. If you have a sales team, assign the sale to the correct rep.
The more accurate your entries, the more reliable your reports will be. Don’t wait until the end of the week. Update your records as sales happen. This gives you real-time insights and avoids missing data.
If you’re using the Daily Sales Record app, you can enter sales in seconds, even offline. Everything syncs when you’re back online, keeping your reports always up to date.
Step 4: Create the Report Format
Now design how your report should look. Choose what data to show, like total sales, rep performance, or product breakdown. Use simple tables or charts for clarity. Keep the layout clean so anyone can read it fast. If you’re using a mobile app, the format is often built-in and updates automatically.
Step 5: Assign to Sales Reps
Assign each sale to the correct sales rep as you record it. This keeps your data organized and makes performance tracking easier. For example, if John sells 5 units and Sarah sells 8, your report can show totals by rep. This way, you can compare results, reward top performers, and spot who needs support.
Step 6: Auto-generate Daily Summary
Once your sales data is being entered consistently, it’s time to generate daily summaries. This gives you a clear picture of each day’s performance without needing to calculate manually.
Here’s how to do it using both spreadsheets and the Daily Sales Record app:
➤ Using Spreadsheets (Google Sheets or Excel)
You can create automatic summaries using simple formulas:
- Use SUMIF to total daily sales:
=SUMIF(A:A, TODAY(), B:B)
(Assumes Column A has dates, and Column B has sales amounts) - Use QUERY to group sales by day:
=QUERY(A:C, “SELECT A, SUM(B) WHERE A IS NOT NULL GROUP BY A”, 1)
(Shows total sales per day from your data range) - Add Pivot Tables to break down sales by rep, region, or product.
- Use Charts to visualize totals that update as data changes.
- Try the Explore tool for instant chart suggestions and summaries.
This setup keeps your reports dynamic and saves you from sorting data manually every day.
➤ Using the Daily Sales Record App
This app makes summaries instant and automatic, no setup or formulas needed:
- Your dashboard updates in real time after every sale
- You can view totals by day, rep, or product
- Filters let you explore sales by time frame or category
- Everything syncs across devices and works offline too
You get clean, accurate summaries without building charts or writing a single formula.
Step 7: Export or Share Reports Instantly
Daily summaries give you a quick view of sales without manual work. In Google Sheets, use =SUMIF(A:A, TODAY(), B:B) to total daily sales, or QUERY to group by date. Pivot tables and charts make your report more visual.
If you use the Daily Sales Record app, summaries update instantly. You can view sales by day, rep, or product without setup or formulas. The goal is simple: see performance in real time and spot trends as they happen.
Step 8: Review Weekly and Optimize
A good daily summary does more than total sales. It highlights patterns, top-selling items, and underperforming reps. Most tools can group data by date automatically. In spreadsheets, use formulas like SUMIF or pivot tables.
In apps like Daily Sales Record, summaries appear instantly. Whatever method you use, your daily report should be clear, automatic, and ready before the next day begins.
Mistakes To Avoid When Automating Daily Sales Reporting
Automation should simplify your workflow, not create confusion. But if you skip the setup thinking it’s just “plug and play,” you’ll run into trouble. Here are real mistakes people make and what to watch for:
- Trying to monitor everything at once clutters your report and hides the numbers that actually matter. Stick to 4–6 key metrics that directly relate to your sales goals, like daily revenue, conversion rate, and rep performance.
- Assuming you’ll fix errors later only creates more work and makes automation pointless. Set up clean data entry rules from the start. Use dropdown menus or form-based input to avoid errors.
- Launching without testing can lead to broken formulas, missing data, or incorrect totals. Run daily reports privately for one week. Cross-check results manually to confirm the data is accurate.
- If the reporting tool is too complex, your team will stop using it, leading to incomplete or missing data. Choose a tool that matches your team’s skill level and workflow. Simplicity always wins in daily routines.
- Without assigning sales to reps, you won’t know who’s performing or struggling. Add a “Sales Rep” column to each entry—filter or group results to monitor individual performance easily.
Common Challenges in Manual Sales Reporting
Manual reporting may seem manageable at first, but hidden problems build fast. It weakens your decision-making and clouds real performance. These are the real issues you run into:
- When reps log sales at the end of the day, they forget exact details, like product codes, time, or even the customer’s name. That leads to gaps in your reporting.
- You can see total sales, but not who’s driving them. Without individual rep breakdowns, you can’t run effective performance reviews or bonus structures.
- Reps might enter the same sale twice or forget to mark returns. Over time, your totals get inflated, and no one knows where the error came from.
- Each team member may use their own spreadsheet layout. One person logs gross revenue, another logs net. You can’t compare them side by side.
- Even one blank cell or new column can break your totals. If someone inserts rows or deletes data, your whole report may stop working.
- You can’t see how today is going until the report is updated, sometimes days later. That makes it hard to adjust tactics quickly.
- If you use separate tools for invoicing, customer tracking, and inventory, you need to export and reformat each one. It adds hours of admin work.
- One rep tracks everything daily. Another update once a week. This inconsistency ruins your ability to compare and slows down planning.
Why is Automating Sales Reports Important for Growth
Automating sales reports is crucial for business growth because it transforms sales data into real-time, accurate insights that drive smarter decisions and faster actions. Studies show that sales teams save up to 6 hours per week by automating reporting tasks, reducing manual errors by nearly 20%.
This efficiency allows teams to focus more on selling and less on data entry. Automated reports also improve lead prioritization and pipeline visibility, helping businesses increase conversion rates by up to 30%. By delivering timely, reliable data, automation empowers sales leaders to quickly identify trends and adjust strategies, fostering agility in a competitive market.
Ultimately, automating sales reports is a powerful growth driver, turning raw data into actionable intelligence that accelerates revenue and scales success. To truly maximize this data and drive continuous growth through channels like SEO and paid marketing, partnering with a specialized digital strategy agency is the crucial next step.
Daily Sales Record – The Smarter Way to Automate Your Sales Reporting
Manual reporting wastes hours and leaves you guessing about daily performance. Daily Sales Record replaces that mess with a streamlined, mobile-first solution designed for real sales environments, like retail counters, warehouses, delivery vans, or the field.
Here’s what you can do with it fast and without training:
- Log daily sales with product, price, quantity, and customer details
- Assign each sale to a rep and track individual performance over time
- Monitor inventory in real-time, reducing manual stock counts
- Auto-generate daily, weekly, or monthly summaries ready for export
- Export reports as Excel or PDF that is shareable by email, print, or cloud
- Use offline and sync when reconnected, perfect for teams in motion
With over 388,000 users and 19 million items tracked, it’s proven, practical, and made to grow with you. Download Daily Sales Record today and stop managing sales with guesswork.
In Closing
Sales reporting is more than recordkeeping. It’s your daily window into performance, problems, and potential. When done manually, it often slows teams down, introduces errors, and leads to missed opportunities.
But when automated correctly, reporting becomes a powerful advantage. You get faster insights, cleaner data, and consistent tracking without the daily grind. Each sale is recorded on time, performance gaps are visible, and decisions are based on facts, not guesses. The key is to start with a clear process, pick the right tool, and build reports that truly reflect how your business moves. Automation isn’t just a time-saver. It’s a growth driver hiding in plain sight.
Frequently Asked Questions
1. How often should I review automated sales reports?
Daily reports are best for monitoring activity and spotting issues early. Weekly and monthly summaries help with trend analysis and planning.
2. Can I automate sales reports if my data comes from multiple sources?
Yes. Use tools that integrate with your CRM, POS, or inventory system or use an automation add-on to pull all data into one place.
3. What’s the best format for a daily sales report?
Keep it simple: date, product, quantity, amount, and sales rep. Include totals and key breakdowns like product category or region.
4. Will automation replace manual checks completely?
Not entirely. It reduces daily effort, but you should still review results regularly to catch edge cases or data input issues.
5. Can I use automation if I don’t have a tech team?
Yes. Tools like Daily Sales Record are designed for non-technical users. You can set up and run reports without writing code.