How to Write a Sales Report: A Template for Small Businesses
Sales leaders today know that data is the backbone of smart decision-making. Without clear visibility into performance, it’s impossible to spot trends, identify bottlenecks, or measure the true impact of sales activities. This is where sales reporting becomes indispensable. Sales reporting is a structured tool that analyzes sales performance. Done right, it aligns teams, informs strategy, and ensures sustainable revenue growth.
So how do you actually write one? The process involves setting clear goals, choosing the right timeframe, collecting accurate data, and presenting it with analysis and visuals that make insights actionable.
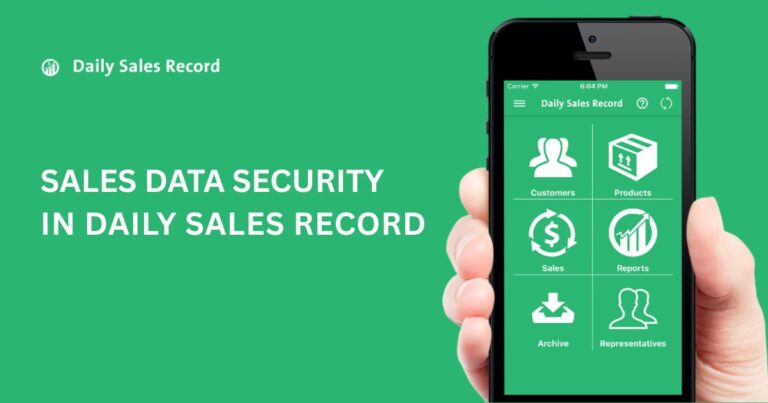
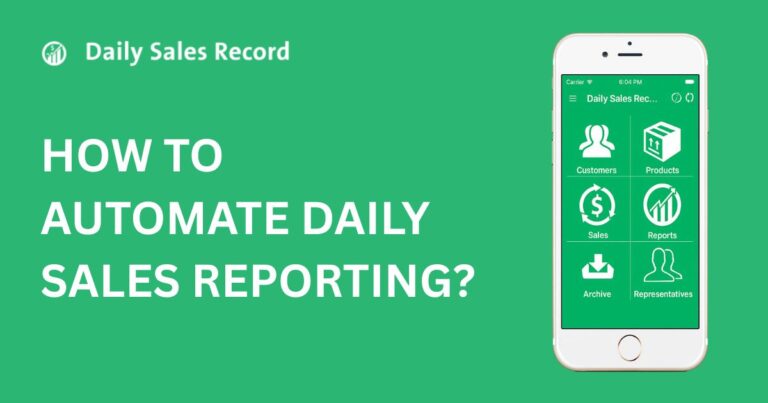
To make the process easier, our Daily Sales Record app streamlines reporting by automatically tracking key sales activities, visualizing performance, and generating ready-to-share reports. With real-time data and customizable dashboards, you save hours of manual work
What Is Sales Rapport?
Sales reporting is a structured process that collects, analyzes, and presents data on sales activities and performance over a defined period. A sales report goes beyond recording numbers.
It reveals trends, customer behavior, and the effectiveness of sales strategies. By combining outcome metrics (revenue, deals closed) with process metrics (calls, leads, meetings), it gives a comprehensive view of sales operations.
When used effectively, sales reports empower decision-makers to allocate resources wisely, set realistic goals, and optimize strategy.
Key Elements of a Sales Report
A well-structured sales report combines data, analysis, and recommendations. Here are the key elements you should always include:
- Title & Timeframe: Specify what the report covers, such as Q3 2025 Sales Report so readers immediately understand its scope.
- Executive Summary: Summarize performance at a glance, such as key wins, major challenges, and overall results in a few sentences.
- Goals & KPIs: List the objectives and the exact metrics (like revenue growth, win rate, or pipeline coverage) that measure success.
- Performance Data: Present hard numbers, like revenue, deals closed, average deal size, or regional performance that track outcomes.
- Visuals & Charts: Use graphs, tables, and dashboards to make trends and comparisons instantly clear.
- Insights & Analysis: Go beyond numbers to explain causes, patterns, and what the data reveals about sales effectiveness.
- Comparisons: Show performance over time (month-over-month or year-over-year) or against targets to highlight progress.
- Actionable Recommendations: Translate insights into specific steps — e.g., “increase outreach in X territory” or “coach reps on late-stage conversions.”
How to Write a Sales Report? Step-by-step Guide
Step 1: Determine your goals
Here’s the truth: most bad sales reports fail before they’re even written.
Why? Because they don’t have a clear goal. Instead of guiding decisions, they just dump numbers on the page.
So before you open Excel (or your CRM dashboard), ask yourself a simple question: “What do I want this report to achieve?”
Your answer will shape everything else.
Here are a few examples:
- Showcase overall results: Maybe you’re writing for executives who only care about revenue and growth. Keep it high-level.
- Coach your team: If the report is for reps, focus on activities, pipeline, and areas to improve.
- Spot trends: Are you looking to identify which product line is driving sales (or which one is dragging you down)? Build your report around that.
Step 2: Set a timeframe
The timeframe determines whether your report helps with day-to-day coaching or long-term strategy. Get this wrong, and even the most accurate numbers won’t tell the right story.
Here’s how to match goals with cadence:
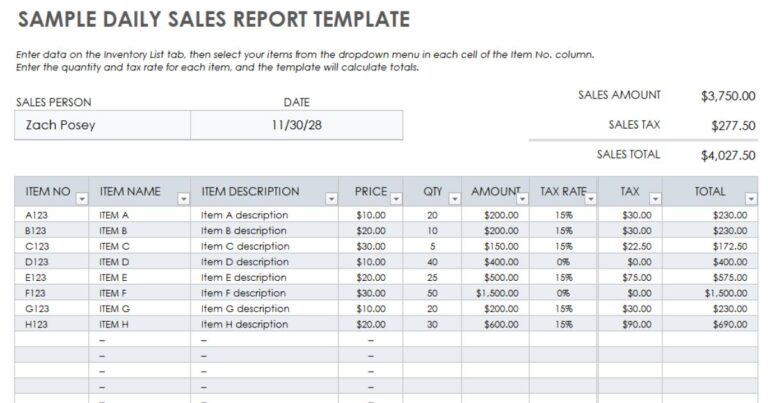
- Daily sales report: A daily sales report is best for tracking activity against short-term goals. It typically includes metrics such as calls made, follow-ups completed, and emails sent. This type of report is ideal if your goal is to keep sales representatives accountable and productive on a day-to-day basis.
- Weekly sales report: A weekly sales report provides a balance of activities and outcomes. It highlights conversion rates, deals advanced in the pipeline, and performance trends for individual reps or teams. This format is perfect when your goal is to coach effectively or identify early issues before they become larger problems.
- Monthly sales report: A monthly sales report offers a broader perspective that covers complete sales cycles. It usually includes revenue trends, win/loss ratios, and pipeline health. This type of report works well if your goal is tactical planning or evaluating how well your current sales strategy is performing.
- Quarterly or annual sales report: A quarterly or annual sales report delivers strategic, high-level insights. It tracks seasonal patterns, compares performance across territories, and shows year-to-date revenue. Executives and boards rely on this type of report to make informed, long-term decisions about growth and resource allocation.
Step 3: Collect relevant data
Now comes the part that makes or breaks your report: selecting the right data.
Here’s the mistake many people make: they pull everything their CRM spits out. The result? Pages of numbers that confuse more than they clarify.
Instead, start with this question:
“Does this metric directly support the goal I set in Step 1?”
If the answer is no, leave it out.
What to include
Think of your data in two categories:
- Outcome metrics → Results that show what’s been achieved. Examples: total revenue, deals closed, win rate, average deal size, quota attainment.
- Process metrics → Activities that drive those results. Examples: calls made, meetings booked, proposals sent, follow-ups completed.
Both matter, but you don’t always need both.
- If your goal is to show pipeline health, focus on open opportunities, conversion rates, and forecasted revenue.
- If your goal is to coach reps, focus on process metrics like call activity, lead response time, and meeting-to-close ratios.
- If your goal is to inform executives, lean on outcome metrics like revenue growth, customer lifetime value, and regional performance.
Pro tip
Always define your filters before pulling data. For example:
- Timeframe (monthly, quarterly, etc.).
- Region or territory.
- Team vs. individual.
- Product line or service category.
Step 5: Add visual elements
At this point, you know your goal, your timeframe, and the data you need. Now it’s time to make that data easy to understand, and that’s where visual elements come in.
Here’s the reality: long tables of numbers make readers tune out. But the right chart or graph can help them spot patterns in seconds.
Why visuals matter?
Think about your audience.
- Executives don’t have time to scan spreadsheets as they want a quick snapshot.
- Sales managers need to identify trends quickly so they can act.
- Reps benefit from seeing where they stand without reading through pages of data.
A strong visual makes all of that possible.
How to use visuals effectively
- Bar and column charts: Use these when you want to compare values across categories. For example, a bar chart can clearly show revenue generated by each sales representative or territory, making it easy to spot top performers at a glance.
- Line charts: Choose a line chart when you need to display changes over time. This is particularly effective for showing trends like monthly revenue growth, changes in win rates, or how pipeline value is shifting across quarters.
- Pie or donut charts: Use pie charts to highlight how a whole breaks into parts. For instance, you can show what percentage of total revenue comes from new customers versus renewals, or how sales are divided across different product lines.
- Tables with highlights: Tables are best when you need to present detailed numbers. To avoid overwhelming readers, apply highlights, color coding, or conditional formatting to draw attention to the most important figures, such as the top 10 deals closed or reps who exceeded quota.
Step 6: Discuss your analysis
Data without context is just numbers. This step is where you explain what the numbers mean and connect them back to your goal. Highlight key trends, strengths, and weaknesses in plain language.
For example, if revenue grew but conversion rates fell, explain why and what it signals for the future. Keep it concise: focus on the two or three insights that matter most. Always tie your analysis to clear actions your audience can take next.
Step 7: Summarize the data
A strong sales report doesn’t bury the big picture. It puts it front and center. That’s where your summary comes in. This section should distill the entire report into a one-page snapshot (or even a few bullet points) that busy readers can absorb in under two minutes.
Here’s what to include:
What to include in a professional summary:
- Overall performance: Start with revenue versus target and percentage growth. This gives readers immediate clarity on success or shortfall.
- Key drivers: Identify the two or three factors that influenced performance (e.g., strong upsells, territory expansion, or a longer sales cycle).
- Critical metrics: Include conversion rate, pipeline coverage, or average deal size — whichever best ties back to your report’s purpose.
- Highlights and risks: Flag standout wins, problem areas, or emerging opportunities that leaders should act on quickly.
- Forward-looking note: End with a short statement on what these results mean for the next reporting period.
Step 8: Improve the report’s appearance
A polished report elevates credibility. Go beyond charts by refining layout and readability: use consistent fonts, align visuals with text, and apply white space to avoid clutter.
Add concise labels, executive-style summaries in callout boxes, and subtle color coding to highlight performance thresholds. These small design choices make insights clearer and decisions faster.
Important Types Of Sales Reports
- Pipeline reports: Pipeline reports give you a real-time snapshot of deal flow across every stage of your sales funnel. Instead of guessing whether your team will hit quota, you can see exactly how many opportunities are in play, their total value, and where deals tend to stall.
- Conversion rates reports: A conversion rates report tracks how effectively leads move through each stage of your sales process. By monitoring conversion rates at each stage, you’ll know whether the challenge lies in lead quality, rep performance, or process design.
- Leaderboards: A leaderboard report ranks sales reps, teams, or regions against defined metrics like revenue closed, deals won, or activities completed. It transforms raw performance data into a transparent, easy-to-read scoreboard.
- Average deal size reports: An average deal size report calculates the typical revenue generated per closed deal. It gives you a clearer picture of the value each opportunity contributes, beyond just counting the number of wins.
- Activity reports: An activity report tracks the actions your sales team takes each day — calls made, emails sent, meetings scheduled, and demos delivered. It focuses on effort rather than outcomes. By monitoring activities, managers can spot productivity gaps early and connect specific actions to sales outcomes.
- Win-loss analysis report: A win-loss report compares opportunities won versus lost, breaking down patterns behind both outcomes. It goes beyond counting deals to uncover why prospects choose (or don’t choose) your solution.
- Revenue by sales rep report: A revenue by sales rep report shows how much revenue each salesperson contributes over a set period. It’s a straightforward way to evaluate individual performance against quotas and team goals.
- Revenue by territory report: A revenue by territory report breaks down sales performance across different regions, markets, or territories. It highlights where demand is strongest and where sales efforts need reinforcement.
- Upsell and cross-sell reports: This report shows which products generate the highest add-on revenue and which reps excel at maximizing customer lifetime value. It also uncovers opportunities where teams may be leaving money on the table.
Best Practices for Writing a Clear & Effective Sales Report
Even the best data can fall flat if your report is cluttered, confusing, or missing context. The goal is not just to present numbers, but to make them actionable. Here are best practices that separate average reports from truly effective ones:
- Use clear titles, consistent formatting, and plain language to ensure readers grasp insights quickly.
- Executives want high-level takeaways; managers may need detailed activity metrics. Match depth to reader needs.
- Lead with the numbers that directly impact business goals, such as revenue, win rate, pipeline coverage.
- Incorporate graphs and charts, but avoid visual clutter. Each chart should emphasize a single insight.
- Don’t just report figures. You should explain why they occurred and what they mean.
- Eliminate irrelevant metrics. A focused report is more engaging and more useful.
- Use the same KPIs and structure period after period to make comparisons easy.
- Use CRM dashboards or BI tools to ensure reports are accurate, timely, and less prone to manual error.
- End with clear recommendations so the report drives action, not just information.
In Closing
Writing a sales report is about more than recording numbers. It’s about transforming data into insights that inspire smarter decisions, stronger strategies, and measurable growth. By setting clear goals, tracking the right KPIs, and presenting your analysis effectively, sales reports become a powerful tool for driving performance and shaping success.
Looking to make reporting effortless? Try the Daily Sales Record app. It streamlines tracking, creates professional reports instantly, and empowers your team to stay focused on achieving results.
Frequently Asked Questions
Question 1: What is the main purpose of a sales report?
Answer: The main purpose of a sales report is to turn sales data into actionable insights. It helps businesses evaluate strategies, monitor performance, and make informed decisions to drive growth.
Question 2: How often should sales reports be created?
Answer: It depends on your goals and audience. Daily or weekly reports are useful for tracking activities, while monthly or quarterly reports are better for strategy, forecasting, and executive updates.
Question 3: Who should read a sales report?
Answer: Sales managers, executives, and even marketing teams. Each uses the insights differently, from coaching individual reps to adjusting overall sales strategies.
Question 4: Can a sales report improve team performance?
Answer: Yes. By highlighting top performers, bottlenecks, and missed opportunities, sales reports foster accountability and give managers the insights needed to coach reps effectively.


