12+ Key Sales Metrics Every Small Business Should Track
For a small business, running on intuition and gut feeling alone is like navigating a ship in a storm without a compass. Sales metrics are that compass. They transform vague feelings about your business’s performance into actionable data. You get clarity, make smart decisions, manage resources, and build a foundation for sustainable growth.
Some important key metrics like average deal size, customer lifetime value, and pipeline coverage reveal what’s working and where you’re losing ground. With the right numbers in hand, you can plan smarter, avoid waste, and scale faster.
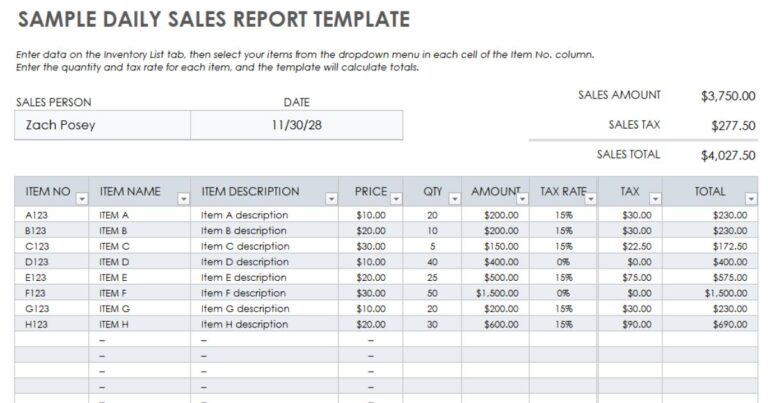
That’s where Daily Sales Record comes in. It tracks these metrics in real time, giving you actionable insights to grow your business with confidence.
What Is Sales Metrics?
Sales metrics are measurable data points that show how effectively your sales process performs. They track everything from the calls you make to the revenue you close. By analyzing these metrics, you can see if your team is focusing on the right activities and whether those efforts actually drive results.
Some metrics, like win rate or customer acquisition cost are so critical that they turn into key performance indicators (KPIs). To gain a complete view, you need a mix of activity metrics, performance outcomes, and customer satisfaction data. Together, they reveal the real story of your sales performance.
12+ Key Sales Metrics Every Small Business Should Track
1. Customer Acquisition Cost (CAC)
Customer Acquisition Cost (CAC) measures the average investment required to secure one paying customer, covering marketing, sales, and related expenses.
It’s vital for tracking sales efficiency, controlling acquisition spending, and aligning customer value with costs. Use CAC to evaluate campaign performance, optimize sales strategies, and plan sustainable growth.
Formula:
To calculate CAC, here is the formula:
CAC = (Total Sales + Marketing Expenses) ÷ Number of New Customers Acquired
How to Calculate (Example):
Imagine you spend $12,000 in one month: $5,000 on ads, $4,000 on salaries, and $3,000 on tools. You close 120 new customers in the same month.
Now divide $12,000 by 120.
CAC = $12,000 ÷ 120 = $100
Your Customer Acquisition Cost is $100.
A CAC of $100 means you spend $100 per customer. That works only if your Customer Lifetime Value (CLV) is at least $300. If CAC is too high, cut weak channels or refine targeting. If it’s low, scale campaigns to accelerate growth.
2. Average Deal Size
Average Deal Size tells you the typical revenue each closed sale brings in. You use it to project future sales, set realistic quotas, and identify trends. Tracking this helps you spot whether your deals are shrinking, growing, or staying stable in your pipeline.
Formula:
To calculate Average Deal Size, here is the formula:
Average Deal Size = Total Sales Revenue ÷ Number of Deals Closed
How to Calculate (Example):
Imagine you closed 10 deals this month worth a combined $100,000. Some were smaller, others larger, but together they make your sales total.
Now divide $100,000 by 10.
Average Deal Size = $100,000 ÷ 10 = $10,000
Your Average Deal Size is $10,000.
An average deal size of $10,000 shows how much revenue you gain per deal. If this number drops, refine upselling or cross-selling. If it rises, push for larger accounts to increase long-term revenue
3. Pipeline Cycle Length (Sales Cycle Time)
Pipeline Cycle Length, or Sales Cycle Time, tracks the average duration from first contact to a closed deal. It matters because it reveals how efficiently your pipeline moves. You use it to forecast revenue, identify bottlenecks, and decide where to improve your sales process.
Formula:
You can calculate Sales Cycle Length with this formula:
Sales Cycle Length = Total Number of Days to Close All Deals ÷ Total Number of Deals
How to Calculate (Example):
Suppose you closed 4 deals this month. Deal A took 10 days, Deal B 15 days, Deal C 20 days, and Deal D 25 days.
Add the total days: 10 + 15 + 20 + 25 = 70 days.
Now divide 70 by 4.
Sales Cycle Length = 70 ÷ 4 = 17.5 days
Your average Sales Cycle Length is 17.5 days.
A 17.5-day cycle is short and efficient, showing deals close quickly. If your cycle grows longer, shorten response times and tighten proposals so prospects commit faster.
4. Employee Turnover Rate
Employee Turnover Rate shows how often employees leave your business within a specific period. It matters because high turnover disrupts sales continuity, increases hiring costs, and hurts team morale. You track this to understand workforce stability, plan staffing, and protect long-term sales performance.
Formula:
The calculation is straightforward:
Employee Turnover Rate = (Number of Employees Who Left ÷ Average Number of Employees) × 100
How to Calculate (Example):
Let’s say your sales team averaged 20 employees this year. During the same period, 4 employees left the company.
Divide 4 by 20, then multiply by 100.
Employee Turnover Rate = (4 ÷ 20) × 100 = 20%
Your Employee Turnover Rate is 20%.
A 20% turnover rate is high for a sales team. You should improve onboarding and invest in retention strategies so you can keep experienced reps and maintain consistent revenue growth.
5. Customer Lifetime Value (CLV/LTV)
Customer Lifetime Value (CLV), also called Lifetime Value (LTV), estimates the total revenue you can expect from a single customer across their entire relationship with your business. It matters because it shows how profitable customers are long term. You use CLV to balance acquisition costs, shape retention strategies, and identify your highest-value customer segments.
Formula:
Here’s the standard formula:
CLV = (Average Purchase Value × Purchase Frequency) × Average Customer Lifespan
How to Calculate (Example):
Assume each customer spends $50 per purchase and buys 3 times a year. On average, a customer stays active for 2 years.
Step 1: Multiply purchase value by frequency → $50 × 3 = $150 per year.
Step 2: Multiply by lifespan → $150 × 2 = $300.
Your Customer Lifetime Value is $300.
A CLV of $300 means each customer generates $300 in lifetime revenue. If CLV is higher than your acquisition cost, you’re profitable. If it’s too low, focus on retention and upselling strategies.
6. Percentage of Appointments Set
Percentage of Appointments Set measures how many of your contacts turn into scheduled meetings. It matters because it shows how well you convert cold outreach into meaningful conversations.
You track this to evaluate rep performance, test outreach quality, and decide where to assign your strongest prospectors.
Formula:
You can calculate it using this formula:
Percentage of Appointments Set = (Appointments Scheduled ÷ Unique Contacts Made) × 100
How to Calculate (Example):
Suppose your sales team contacted 200 unique prospects last week. Out of these, 40 agreed to schedule appointments.
Step 1: Divide appointments by contacts → 40 ÷ 200 = 0.20.
Step 2: Multiply by 100 → 0.20 × 100 = 20%.
Your Percentage of Appointments Set is 20%.
A 20% appointment rate means one in five contacts turns into a meeting. If this number is low, refine messaging and targeting. If it’s high, push those reps earlier in the funnel.
7. Annual Recurring Revenue (ARR)
ARR reflects the reliable yearly income you generate from subscription contracts or renewable deals. For sales tracking, it shows stability rather than short-term wins. You rely on ARR to plan long-term growth, evaluate recurring value, and track retention against expansion opportunities.
Formula:
You calculate ARR with this formula:
ARR = (Total Contract Value ÷ Contract Duration in Years)
How to Calculate (Example):
Suppose you close a 5-year contract worth $25,000. To find ARR, divide the contract value by the number of years.
Step 1: $25,000 ÷ 5 = $5,000.
Your Annual Recurring Revenue is $5,000.
An ARR of $5,000 per customer means consistent yearly revenue. If ARR is growing, expand upsells and renewals. If it’s flat or dropping, reduce churn and improve subscription value.
8. Average Revenue per User/Account (ARPU/ARPA)
Average Revenue per User (ARPU) or per Account (ARPA) shows the revenue you earn from each customer over a set period. In sales tracking, it highlights customer value at the individual level. You use it to compare customer segments, assess pricing effectiveness, and identify upsell opportunities.
Formula:
You calculate ARPU/ARPA using this formula:
ARPU/ARPA = Total Revenue ÷ Average Number of Users or Accounts
How to Calculate (Example):
Assume your company made $500,000 in revenue during Q2. During that time, you served an average of 5,000 customers.
Step 1: Divide $500,000 by 5,000.
Step 2: $500,000 ÷ 5,000 = $100.
Your Average Revenue per User is $100.
An ARPU of $100 shows each customer generates $100 in quarterly revenue. This indicates modest per-customer value. If you want stronger revenue growth, you should refine pricing models and create upsell opportunities.
9. Quota Attainment
Quota Attainment measures how close your sales team or reps come to meeting assigned sales targets. It’s one of the most direct ways to track performance. You use it to recognize top performers, identify struggling reps, and adjust targets to match realistic sales capacity.
Formula:
You calculate Quota Attainment with this formula:
Quota Attainment = (Actual Sales ÷ Sales Quota) × 100
How to Calculate (Example):
Suppose a salesperson has a monthly quota of $50,000. By the end of the month, they closed $35,000 in deals.
Step 1: Divide $35,000 by $50,000 → 0.70.
Step 2: Multiply by 100 → 70%.
Their Quota Attainment is 70%.
A 70% quota attainment means the rep fell short of expectations. This signals either overly ambitious targets or performance gaps. You should review deal pipelines and provide training to bring results closer to 100%.
10. Win Rate
Win Rate measures the percentage of deals you close compared to the total you pursue. You use it to judge sales effectiveness, compare performance across reps, and identify weak spots in your pipeline. A stronger win rate shows sharper targeting and better closing skills.
Formula:
To calculate Win Rate, here is the formula:
Win Rate = (Number of Deals Won ÷ Total Deals Created) × 100
How to Calculate (Example):
Imagine you worked on 40 deals this quarter. Out of these, you successfully closed 10 deals and lost the rest.
Now divide 10 by 40, then multiply by 100.
Win Rate = (10 ÷ 40) × 100 = 25%
Your Win Rate is 25%.
A 25% win rate is low for most industries. You should improve lead qualification and strengthen proposals. This way, you can attract better prospects and convert more opportunities into revenue.
11. Pipeline Coverage
Pipeline Coverage compares the value of your sales opportunities to your assigned quota. It tells you if your pipeline is strong enough to hit targets. You track it to forecast more accurately, spot gaps early, and guide reps on building healthier pipelines.
Formula:
You calculate Pipeline Coverage with this formula:
Pipeline Coverage = Pipeline Value ÷ Sales Quota
How to Calculate (Example):
Suppose your quarterly quota is $100,000. At the start of the quarter, you have opportunities worth $300,000 in your pipeline.
Step 1: Divide $300,000 by $100,000 → 3.0.
Your Pipeline Coverage is 3x.
A 3x pipeline coverage means you have three times more opportunities than your quota. This is strong and raises your chance of hitting targets. If coverage is weak, focus on prospecting and expanding lead generation.
12. Net Promoter Score (NPS)
Net Promoter Score (NPS) measures customer loyalty by asking one simple question: “How likely are you to recommend us to others?” It’s critical for sales tracking because it highlights long-term satisfaction.
A higher NPS signals strong customer advocacy, repeat business potential, and opportunities for referrals.
Formula:
You calculate NPS with this formula:
NPS = % Promoters – % Detractors
(Promoters = score 9–10, Passives = 7–8, Detractors = 0–6)
How to Calculate (Example):
Let’s say you survey 100 customers.
60 give you a 9 or 10 (Promoters).
20 give you a 7 or 8 (Passives).
20 give you 0–6 (Detractors).
Step 1: % Promoters = 60%.
Step 2: % Detractors = 20%.
Step 3: 60% – 20% = 40.
Your Net Promoter Score is 40.
An NPS of 40 is good, it means most customers are advocates. To raise it further, improve follow-ups and personalize service. If it drops, act fast on feedback before loyalty erodes.
13. Operating Cash Flow
Operating Cash Flow (OCF) shows how much cash your business generates from its core operations. Unlike profit, it excludes financing and investments.
For sales tracking, OCF proves whether revenue activities truly bring in liquid cash. Strong OCF means you can reinvest in growth, cover expenses, and scale sustainably.
Formula:
To calculate OCF, use this formula:
OCF = Cash Inflows from Operations – Cash Outflows from Operations
How to Calculate (Example):
Suppose in a quarter your company collects $150,000 from customer payments. Operating expenses like salaries, rent, and utilities total $90,000.
Step 1: Subtract $90,000 from $150,000.
Step 2: $150,000 – $90,000 = $60,000.
Your Operating Cash Flow is $60,000.
A positive OCF of $60,000 shows healthy cash from operations. This lets you invest in marketing, hire staff, or expand. If OCF turns negative, cut unnecessary costs or speed up collections to stay stable.
Importance of Sales Metrics for Small Business
Here are four of the most critical reasons why tracking sales metrics is essential for any small business:
1. Enables Data-Driven Strategic Decisions
Relying on guesswork is a luxury small businesses cannot afford. Sales metrics replace assumptions with facts, allowing you to allocate your limited time, money, and effort where they will have the greatest impact.
2. Provides Accurate Forecasting and Financial Stability
Predicting future revenue is not just for large corporations; it’s a vital survival tool for small businesses. Accurate forecasting allows you to manage cash flow, plan for expenses, and make informed decisions about hiring and expansion
3. Drives Team Performance and Accountability
You can’t improve what you don’t measure. Metrics create clear, objective standards for what success looks like, which helps you manage your team effectively and fosters a culture of accountability and continuous improvement.
4. Identifies and Eliminates Inefficiency
Every small business has bottlenecks in its sales process where deals slow down or get lost. Sales metrics act like a diagnostic tool, shining a light on these friction points so you can fix them.
In Closing
Sales metrics give small businesses the clarity they need to grow with confidence. From tracking acquisition costs and win rates to monitoring sales cycles and customer value, these numbers show exactly what drives success, and where improvements are needed.
By focusing on the right metrics, you can turn daily sales efforts into predictable, sustainable growth.
Ready to simplify the process? With Daily Sales Record, you can track, analyze, and act on your sales data, all in one place. Start making smarter decisions today.
Frequently Asked Questions
Question: How often should small businesses track sales metrics?
Answer: Track activity metrics like calls or appointments weekly, and performance metrics like revenue, win rate, or churn monthly or quarterly. This keeps data relevant and actionable.
Question: What is the difference between sales metrics and financial metrics?
Answer: Sales metrics focus on sales activities and outcomes, such as win rate or pipeline coverage. Financial metrics measure overall business health, including profit, expenses, and cash flow.
Question: Can sales metrics improve forecasting accuracy?
Answer: Yes. Metrics like sales cycle length, pipeline coverage, and quota attainment provide reliable data to predict revenue, highlight risks, and adjust strategies early.
Question: Do all small businesses need the same sales metrics?
Answer: No. The right metrics depend on your business model. SaaS companies track churn and recurring revenue, while retail may focus more on margins and customer acquisition.